Bitcoin Faces a ‘Likely’ Breakdown From a 50-Month Trend Line


Bitcoin (BTC) hovered near two-month lows on Wednesday as 2022 bear-market comparisons returned.
Key points:
- Bitcoin traders bring back the 2022 bear market to assess where BTC price action might go next.
- History shows a new lower high followed by a breakdown of a key 50-month trend line.
- That trend line has held throughout 2026 so far.
Analysis: Bitcoin 50-month trend line break down “likely”
Data from TradingView showed cooling BTC price volatility after a trip to $65,362 on Bitstamp — a level last seen in early April.
BTC/USD one-hour chart. Source: Cointelegraph/TradingView
After billions of dollars in liquidations, BTC/USD fielded new warnings that the worst of the bear market may still be ahead.
Trader and analyst Rekt Capital focused on the 50-month exponential moving average (EMA) trend line at $66,628.
“Over time, Bitcoin is likely to breakdown from this EMA and continue macro downside in this Bear Market,” he warned in one of several posts on X.
Rekt Capital said that if history were to repeat from the 2022 bear market, price should now see a relief bounce to form a lower high before returning to the 50-month EMA, which would in turn fail as support.
“Historically, Bitcoin tends to rebound initially from the 50-Month EMA but then loses it as support as the Bear Cycle progresses,” he added.
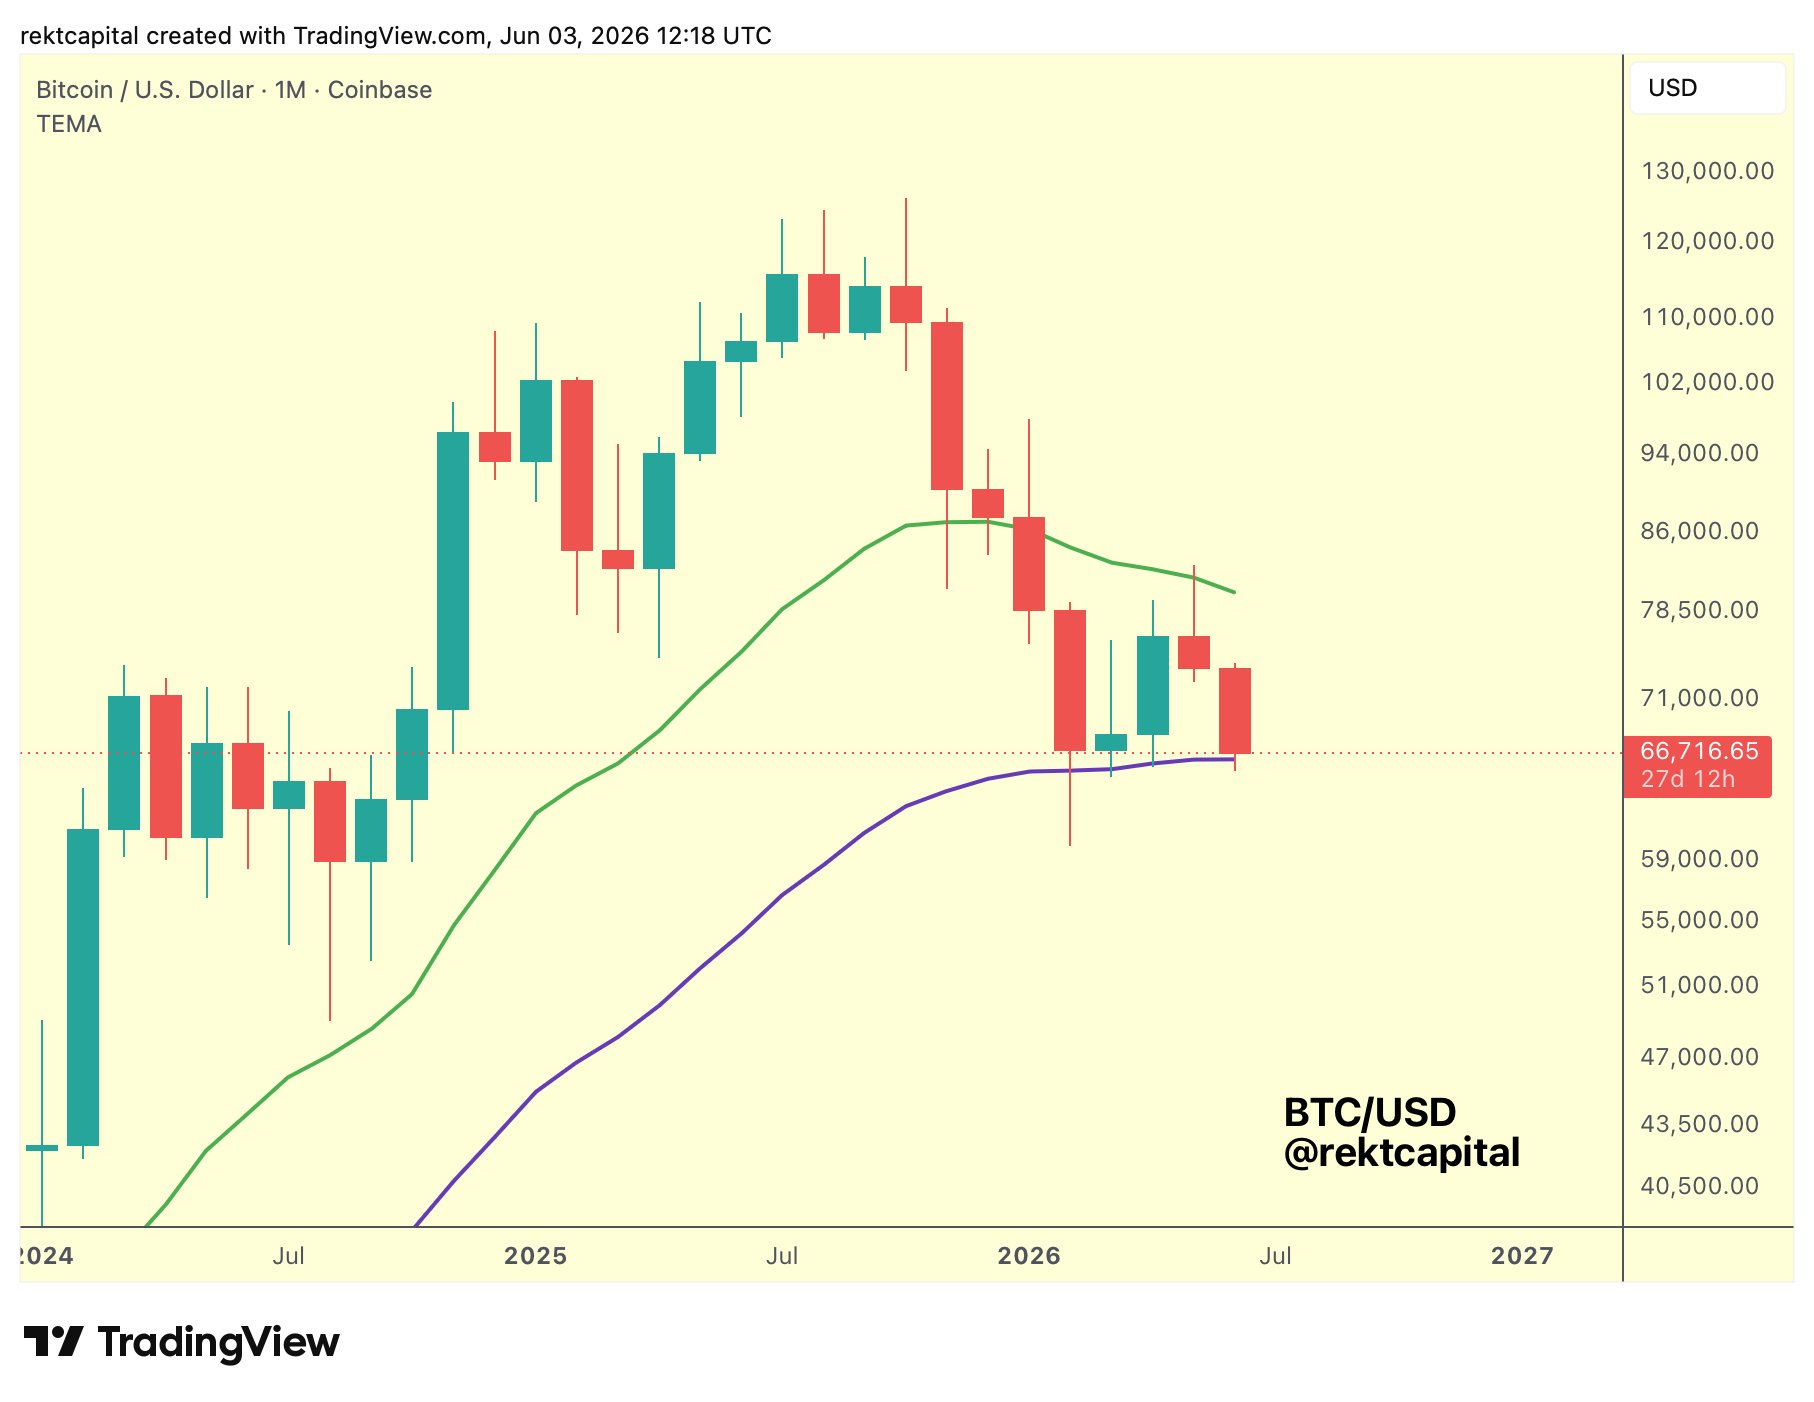
BTC/USD one-month chart with 21, 50EMA. Source: Rekt Capital/X
Continuing, trader Leviathan argued that the 2026 bear market was copying its predecessor “almost perfectly.”
“Every stage printing in the same order,” an X post reported, calling $60,000 the “line that matters.”
“Hold it – liquidity flush complete, recovery begins. Lose it – deeper correction, no support below. One level, two completely different outcomes. Market makes the call soon.”
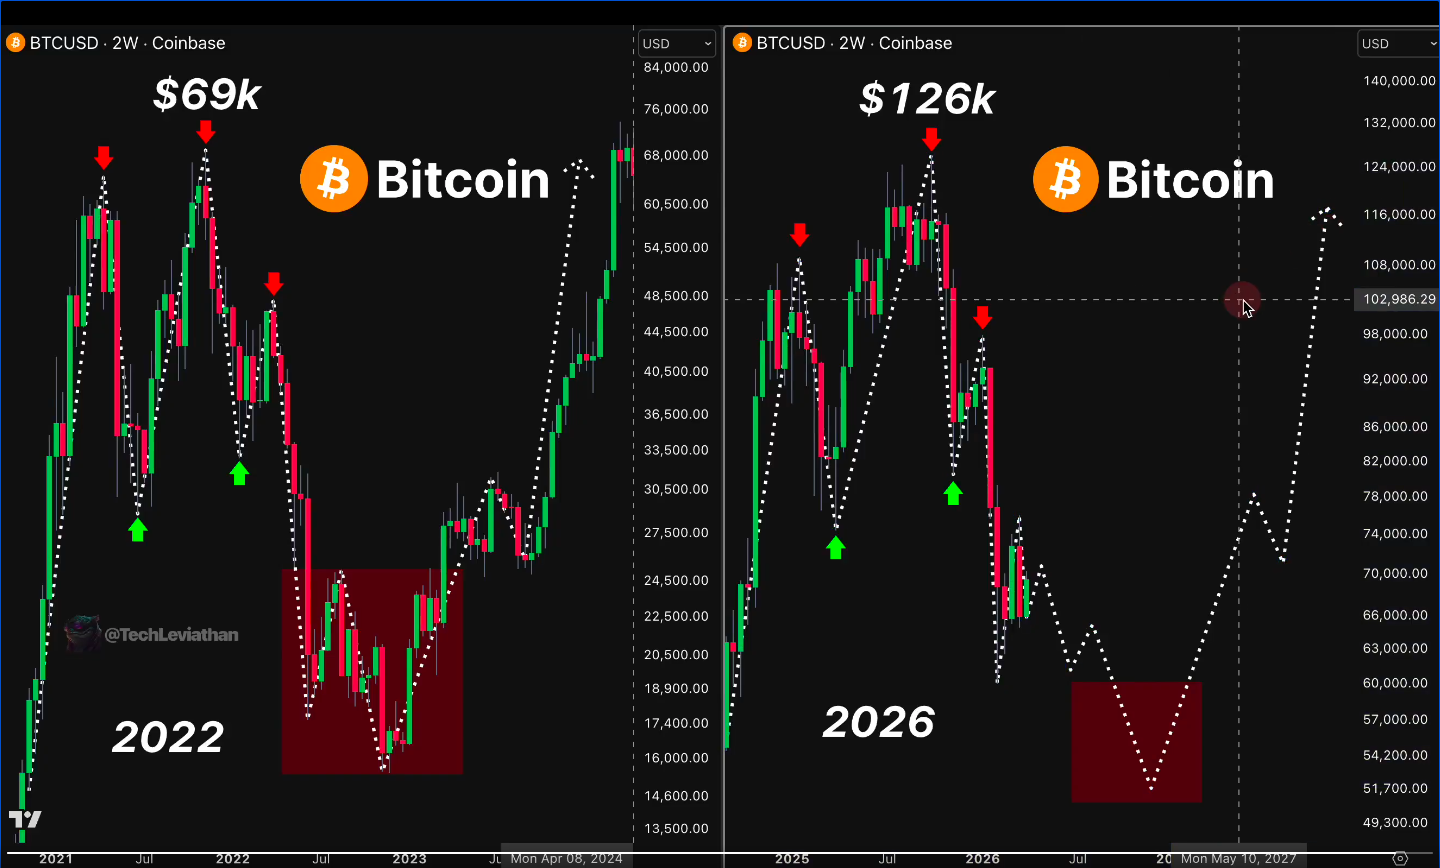
BTC/USD two-week chart comparison. Source: Leviathan/X
Another trader, Killa, leveraged 2022 price action to suggest “weeks” of consolidatory movement between $63,000 and $65,000 next.
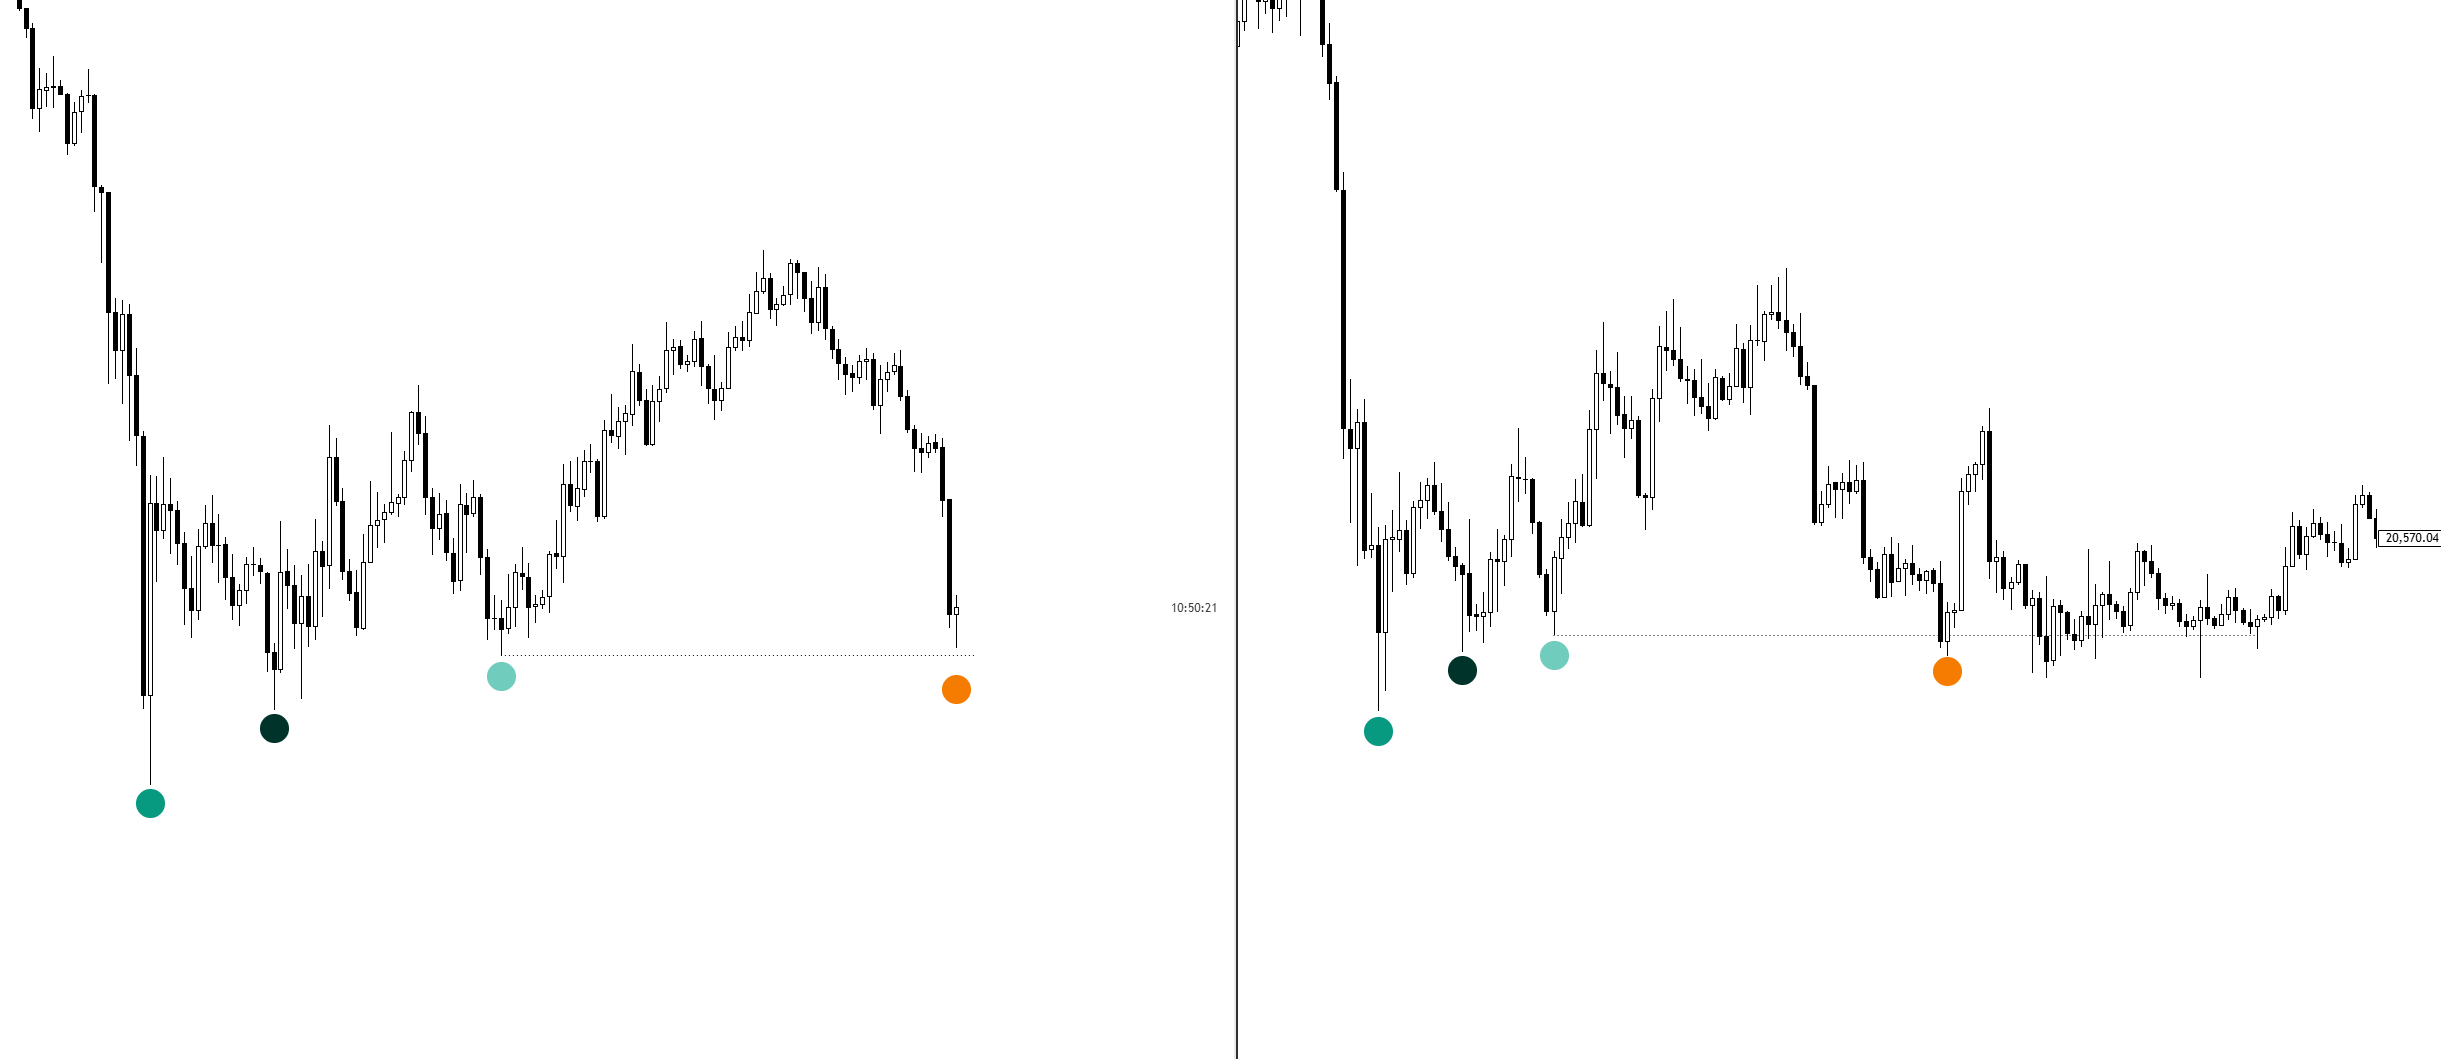
BTC price chart comparison. Source: Killa/X
BTC price support reclaim could offer 700%+ returns
A silver lining on the day came from historical reactions to the 50-month EMA.
Related: Bitcoin has hit ‘max fear’ below $67K as analysis sees BTC price rebound
Analytics account Paradox noted the extent of potential gains that could come from Bitcoin’s eventual reclaim of the trend line after losing it.
“$BTC lost the monthly 50MA in 2022. It reclaimed it 5 months later, delivering a 715% return over the next 2 years,” it told X followers.
In February, BTC/USD saw several daily closes below the trend line, ultimately avoiding a full breakdown. In March and April, meanwhile, it functioned successfully as support.
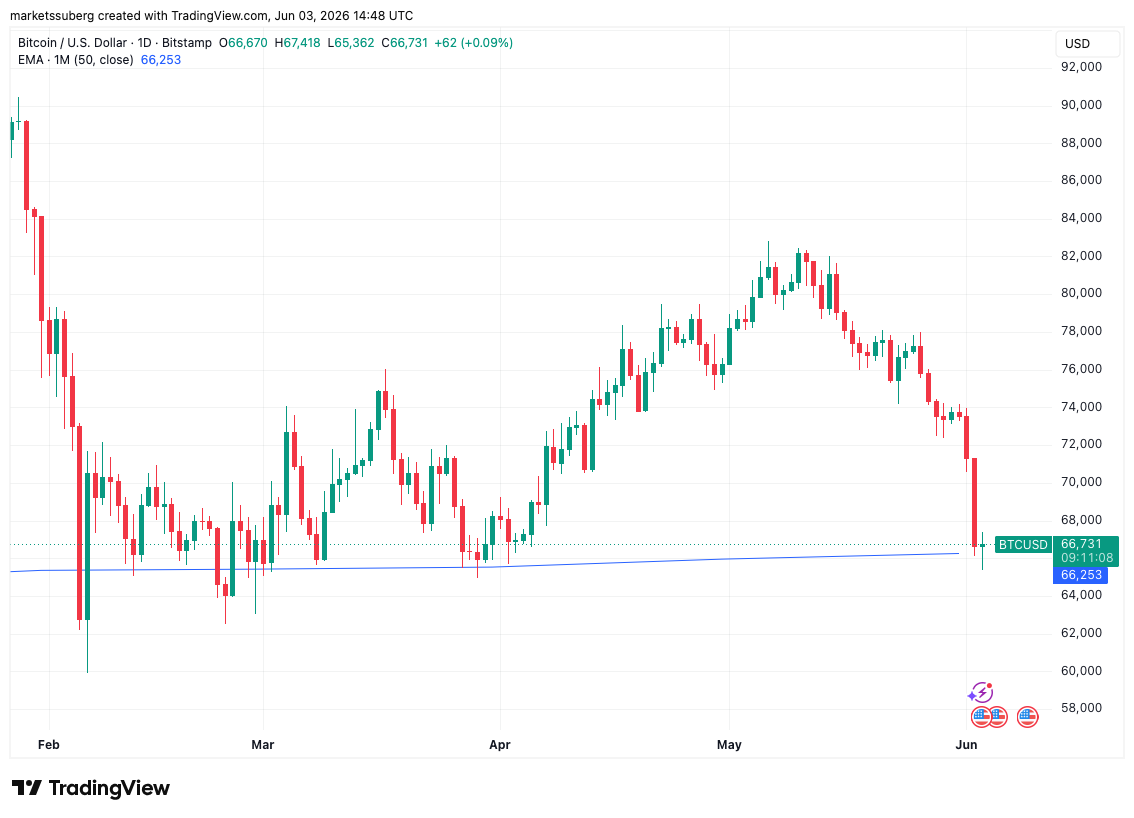
BTC/USD one-day chart with 50-month EMA (blue line). Source: Cointelegraph/TradingView
